“If debugging is the process of removing software bugs, then programming must be the process of putting them in” – Edsger Dijkstra (Dutch computer scientist, winner of the 1972 Turing Award)
One cannot simply start debugging of a program unless he/she knows how the program is built or how it is working. For the programmers who wrote that program, finding bug is much easy as they know where and how of that thing.
So a few steps to make debugging easy:
- Comment your program appropriately, it is the single most powerful weapon you have, while debugging a large chunk of code.
- Make your code as readable as possible, coz Martin goldman once said “Always code as if the guy who ends up maintaining your code will be a violent psychopath who knows where you live”.
Debugging In WordPress
WordPress has many inbuilt features to make debugging easy. Some of these tools are listed below and should be used in development phase.
Debugging With WP_DEBUG
The most important debugging tool you need to know about is WP_DEBUG.
WP_DEBUG is a boolean constant, which triggers the “debug” mode throughout WordPress. It’s found in the wp-config.php file in your WordPress install. When set to “true,” you’ll start seeing PHP notices – not so much errors as they are helpful messages for developers – and WordPress-generated debug messages, particularly deprecated function usage, displayed on your site’s pages.
To turn on WP_DEBUG, simply add the following line of code to your wp-config.php file:
define( 'WP_DEBUG', true );
To turn the constant off, just replace “true” with “false”. WP_DEBUG is set to false by default.
WP_DEBUG provides a handy way to troubleshoot problems when something goes wrong with your site.
It’s important to keep in mind that WP_DEBUG should not be used on a live site. While it’s a useful feature during development, it can be dangerous on a live site because text in the PHP notices can reveal details about your code, paths and other information to visitors to your site.
Logging Errors With WP_DEBUG_LOG
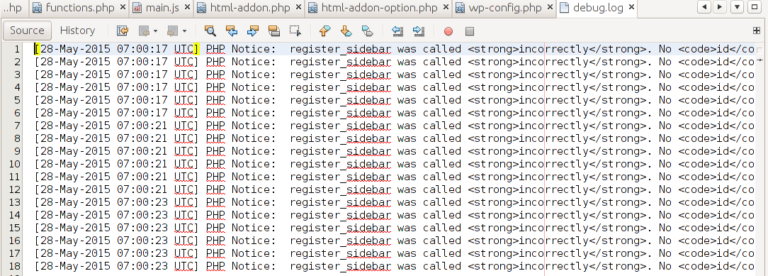
Another handy tool is WP_DEBUG_LOG, which can be used in conjunction with WP_DEBUG to save all error messages to a debug.log file located in the /wp-content/ directory of your site. This is an especially useful feature if you want to review notices later and see the difference after some changes in code.
To turn on debug logging, simply add the following line of code to your wp-config.php file:
define('WP_DEBUG_LOG', true);
Turn Off Displaying Errors On Your Site With WP_DEBUG_DISPLAY
If you don’t want error messages published to your site’s pages you should use WP_DEBUG_DISPLAY. This is another useful constant, which allows you to control whether debug messages are shown inside the HTML of your site. The default is “true,” which shows errors and warnings as they are generated. Changing this to “false” will hide all errors.
This constant should be used in conjunction with WP_DEBUG_LOG.
To use this feature, just add the following line of code to your wp-config.php file:
define('WP_DEBUG_DISPLAY', false);
So using this tool you have prevented error messages to be displayed on website and still you can see them.

SCRIPT_DEBUG
In the admin, WordPress minimizes and concatenates JavaScript and CSS. But WP also comes with the “development” scripts, in the form of dev.js and dev.css. To use these instead:
define( 'SCRIPT_DEBUG', true );
SAVEQUERIES
The WordPress database class can be told to store query history:
define( 'SAVEQUERIES', true );
When this is defined, $wpdb->queries stores an array of queries that were executed, along with the time it takes to execute them.
Note: Enabling this setting affects your site’s performance. You should only enable this setting for as long as it is necessary to debug a problem, and then disable it.
Following PHP code snippet demonstrates how to dump the entire contents of the $wpdb->queries array to a page:
<?php

global $wpdb;

print_r( $wpdb->queries );

?>
The ‘all’ and ‘shutdown’ hooks
There’s an ‘all’ hook that fires for all actions and filters. Example usage:
add_action( 'all', create_function( '', 'var_dump( current_filter() );' ) );
You’ll be surprised how many hooks get executed on every page load. Good for troubleshooting and identifying the right hook.
There’s also a ‘shutdown’ hook you can use in combination with, say, SAVEQUERIES, and write the query information to the database. It’s the last hook to run.
All putting in one:
// Turn debugging on

define('WP_DEBUG', true);

// Tell WordPress to log everything to /wp-content/debug.log

define('WP_DEBUG_LOG', true);

// Turn off the display of error messages on your site

define('WP_DEBUG_DISPLAY', false);

// For good measure, you can also add the follow code, which will hide errors from being displayed on-screen

@ini_set('display_errors', 0);

//to display dev.js and dev.css

define( 'SCRIPT_DEBUG', true );

//to save all the executed queries in $wpdb->queries array.

define( 'SAVEQUERIES', true );

//to dsiplay all the hooks and filters executed on page

add_action( 'all', create_function( '', 'var_dump( current_filter() );' ) );
Don’t forget that WP_DEBUG is for local development use and should not be used on live sites. Unless you may be telling the hackers the vulnerabilities in your website.
Few Other WordPress Plugins that Help in Debugging:
- AskApache Debug Viewer – (https://wordpress.org/plugins/askapache-debug-viewer/)
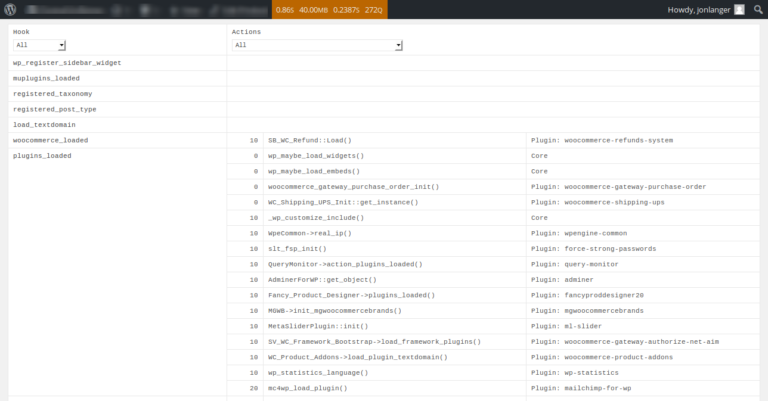
- Query Monitor – (https://wordpress.org/plugins/query-monitor/) This plugin will do all the work, required to get the hint of problem in debugging and this has literally saved my day many times.

Below you can see the detailed data of Hooks executed on this page
- Log Deprecated Notices – Plugin that searches for deprecated functions in your code. (https://wordpress.org/plugins/log-deprecated-notices/)
- Debug Bar – Adds a debug menu to the admin bar that shows query, cache, and other helpful debugging information. (https://wordpress.org/plugins/debug-bar/)
Despite these tools and techniques, a problem can get stuck for hours/days and the solution was so simple that you might have called yourself an idiot (happened with me many times).
Nevertheless, at last I would like to conclude that debugging becomes very simple if you have taken good care while writing the code.
“Any fool can write code that a computer can understand. Good programmers write code that humans can understand” – Martin Fowler
Refrences:
- http://nacin.com/2010/04/23/5-ways-to-debug-wordpress/
- http://premium.wpmudev.org/blog/debugging-wordpress-how-to-use-wp_debug/
- Software engineering, by Roger Pressmen


